
Background
Multimorbidity is a growing health challenge but there are limited data on disease co-occurrence patterns, especially in ethnic minorities and younger people. Frequently occurring disease combinations could inform healthcare provision, guideline development, and clinical trial design, while non-random disease associations could indicate shared risk factors or pathophysiology. We developed a data driven framework for estimating the frequency of common disease combinations and identifying non-random disease associations for all ages in a multi-ethnic population.
Methods
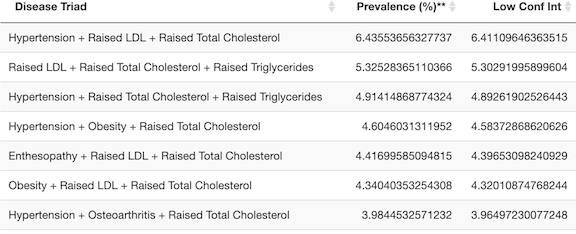
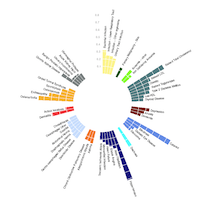
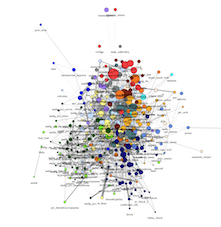
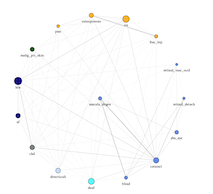
We examined multimorbidity and comorbidity patterns stratified by ethnicity, sex, and age for 308 health conditions in 3,872,451 individuals using population based electronic health records (EHR) from the Clinical Practice Research Datalink (CPRD) linked to the Hospital Episode Statistics admitted patient care (HES-APC) dataset in England. First, we identified the most prevalent combinations of conditions and comorbidities for index conditions. Next, we used the partial correlation in network analysis to find conditions that co-occurred more often than expected by chance. We developed online interactive tools enabling users to explore multimorbidity and comorbidity patterns in stratified subgroups.
Findings
A higher proportion of boys under the age of ten (48%) had two or more diagnosed conditions than girls (40%). However, above the age of ten, more females in each decade of life were diagnosed with multimorbidity than males. White individuals (78.7%) were more likely to be diagnosed with two or more conditions compared to black (60.1%) or south-Asian individuals (60.2%).
Depression commonly co-occurred with anxiety, migraine, obesity, atopic conditions, deafness, soft tissue disorders and gastrointestinal disorders. Except for anxiety and migraine, these conditions are not mentioned in NICE guidelines on depression. Coronary heart disease, valvular disease, cardiac arrhythmias, lung diseases, musculoskeletal diseases, hypertension, renal insufficiency, type 2 diabetes, and peripheral vascular disease were very common in patients with heart failure, yet heart failure trials often exclude patients with these conditions.
Spinal fractures were most strongly associated beyond chance with malignancy and infection in black individuals, but with osteoporosis in white individuals. Hypertension was most strongly associated with kidney disorders in those aged 20-29 years, but with dyslipidaemia, obesity, and diabetes in individuals above the age of 40 years. Breast cancer, asthma and bipolar affective disorder were strongly associated with different comorbidities in different ethnic, sex, and age subgroups respectively.
Interpretation
We have presented a data-driven framework with interactive visualisation of multimorbidity and comorbidity patterns for a wide range of diseases stratified by ethnicity, sex, and age. Our online tools provide a resource for multiple stakeholders: patients and their clinicians (to prevent and detect comorbid conditions); research funders and policymakers (to redesign service provision, training priorities and guideline development); and biomedical researchers and manufacturers of medicines (to provide leads for research into common or sequential pathways of disease and inform the design of clinical trials).
Interactive tools
We have created a series of interactive R Shiny apps to explore the underlying data and our findings. Information on the defined populations be downloaded from here
Phenotyping algorithms
Human-friendly versions of disease EHR phenotypes can be browsed on the HDR UK Phenotypes Library.
Machine readable versions of the EHR phenotyping algorithms are available in our repository.
More details on the phenotyping apporach can be found in: Kuan V. et. al. Lancet Digit Health. 2019 May 20;1(2):e63-e77. doi: 10.1016/S2589-7500(19)30012-3